Interactive GUI and debugging#
Genesis World gives you three complementary tools for understanding what a scene is doing: rich interactive inspection of any object from a Python shell, debug geometry drawn straight into the viewer, and an in-viewer GUI panel for driving the simulation by hand. Reach for them while prototyping a scene, tracking down a misplaced entity, or checking a frame or contact point without writing a plot.
Two runnable examples back this page:
interactive_debugging.pydrops you into an IPython shell to inspect a built scene.draw_debug.pydraws boxes, lines, arrows, spheres, and frames into the viewer and clears them again.
Inspecting objects interactively#
Every Genesis World class implements a __repr__ that prints its type, state, and available attributes, formatted and colorized. Instead of guessing an object’s fields or reading source, drop into an interactive shell after building the scene and type the object’s name. This works in IPython, pdb, ipdb, or a plain Python shell.
The example builds a minimal scene and hands control to IPython:
import genesis as gs

gs.init()

scene = gs.Scene(show_viewer=False)

plane = scene.add_entity(gs.morphs.Plane())
franka = scene.add_entity(
    gs.morphs.MJCF(file="xml/franka_emika_panda/panda.xml"),
)

cam_0 = scene.add_camera()
scene.build()

# enter IPython's interactive mode
import IPython

IPython.embed()
Run the script directly (install IPython first with pip install ipython), or paste everything except the last line into an existing IPython session. From there, walk the scene from the top down.
Type scene to see what the scene holds:
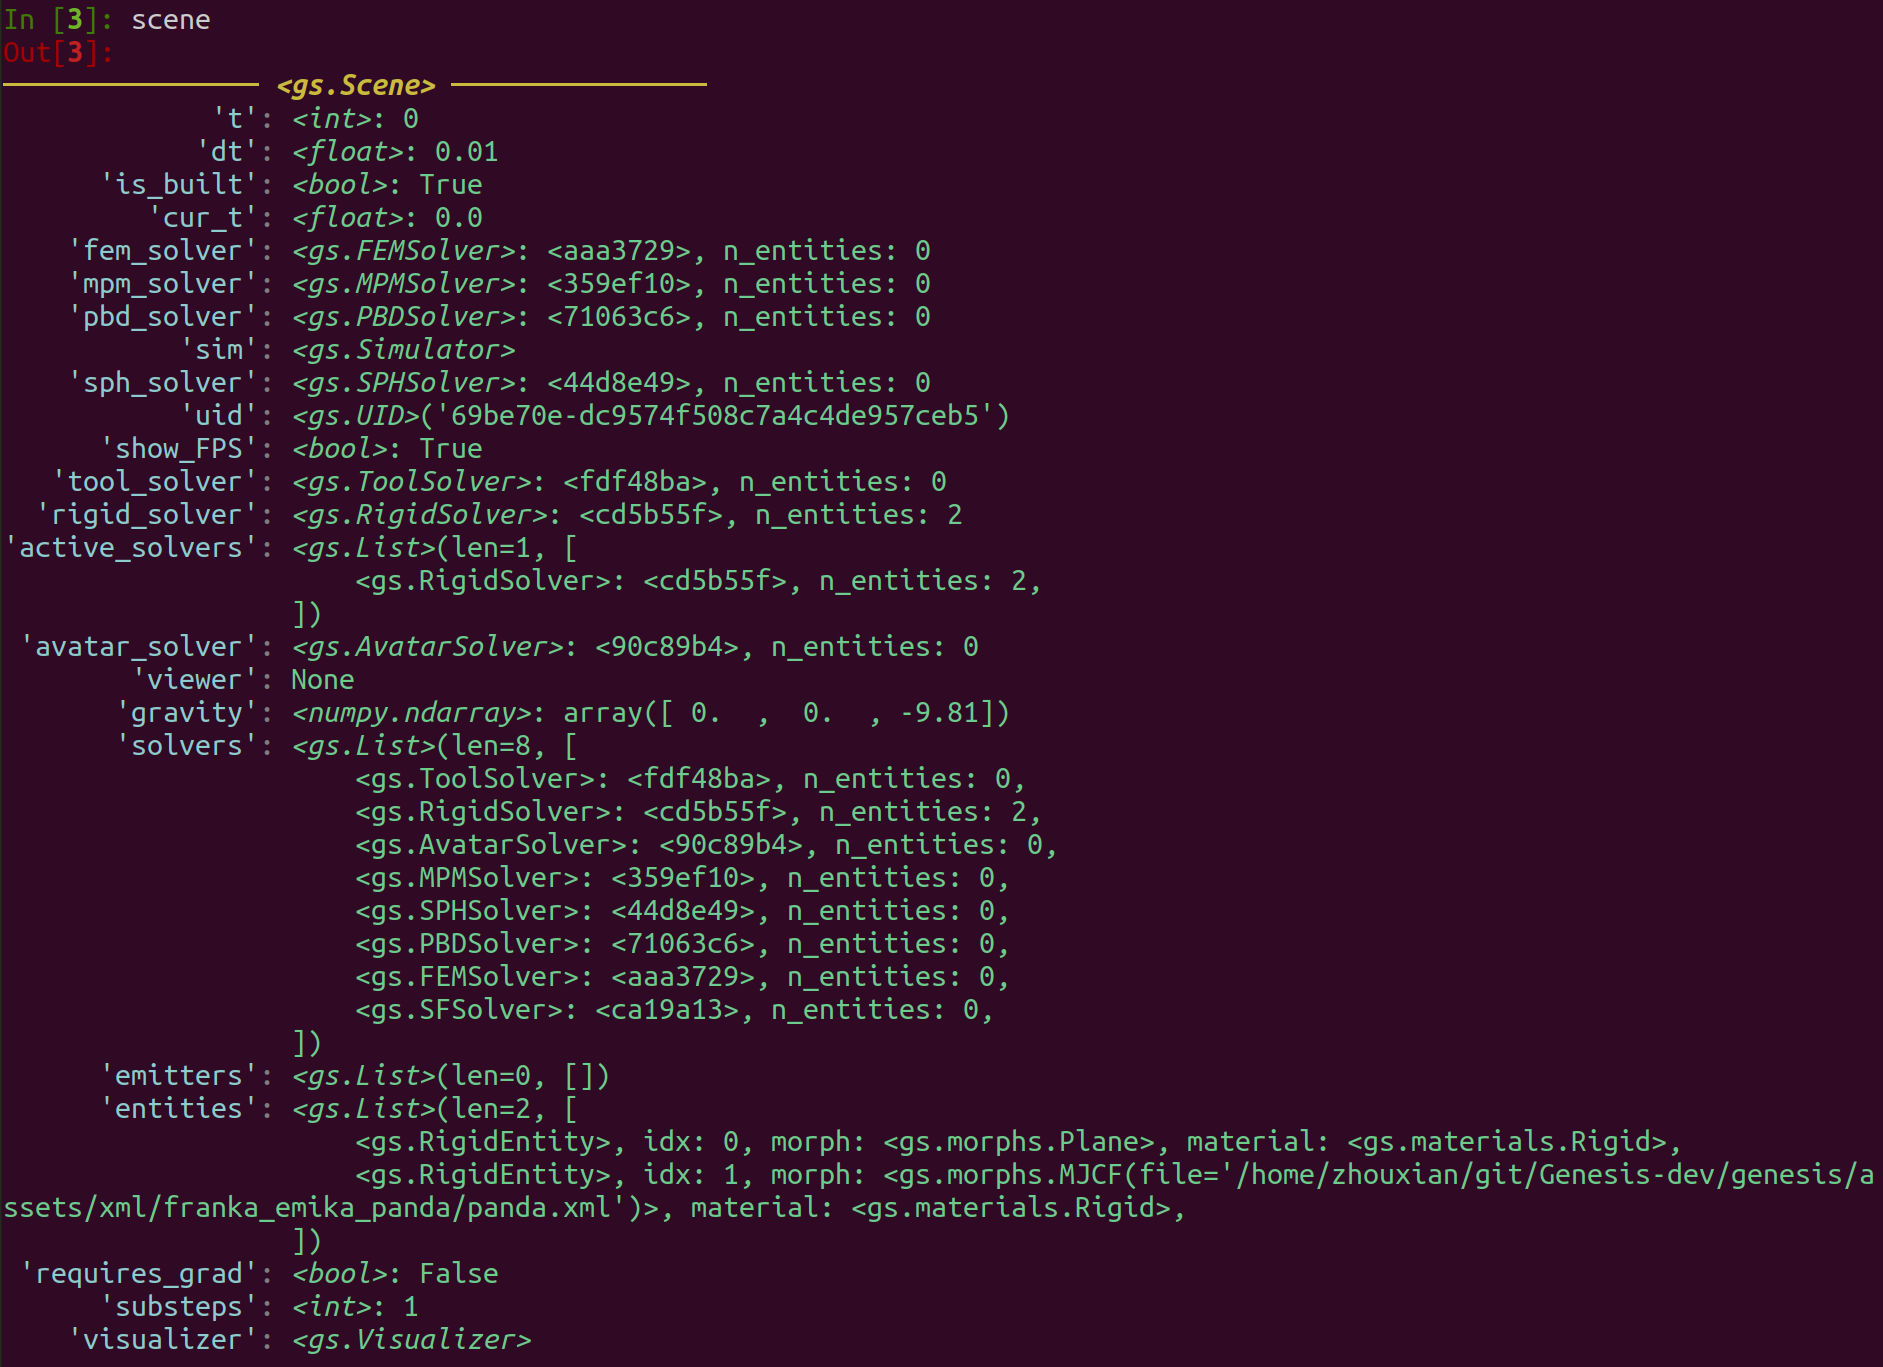
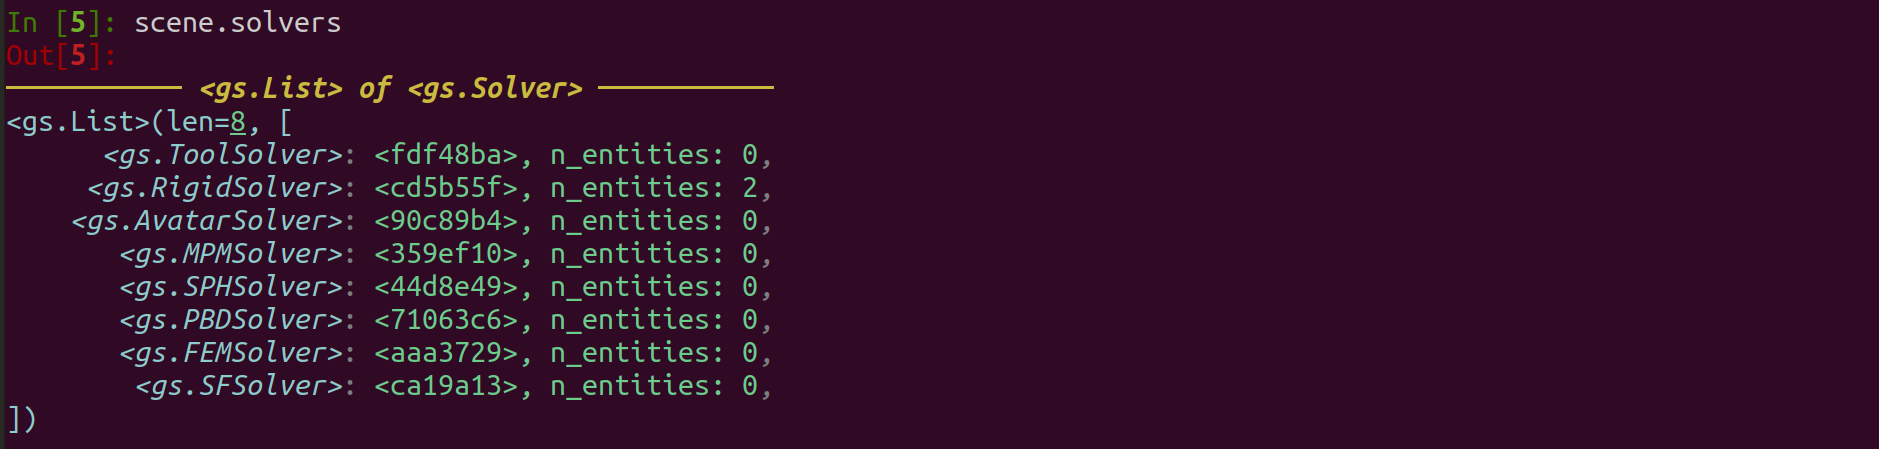
The first line shows the object’s type (<gs.Scene>). Below it are the readable attributes: is_built is True, the timestep dt is 0.01 s, uid is the scene’s unique id, and solvers is the list of physics solvers. Follow any attribute deeper. scene.solvers is a gs.List, which is rendered the same way:
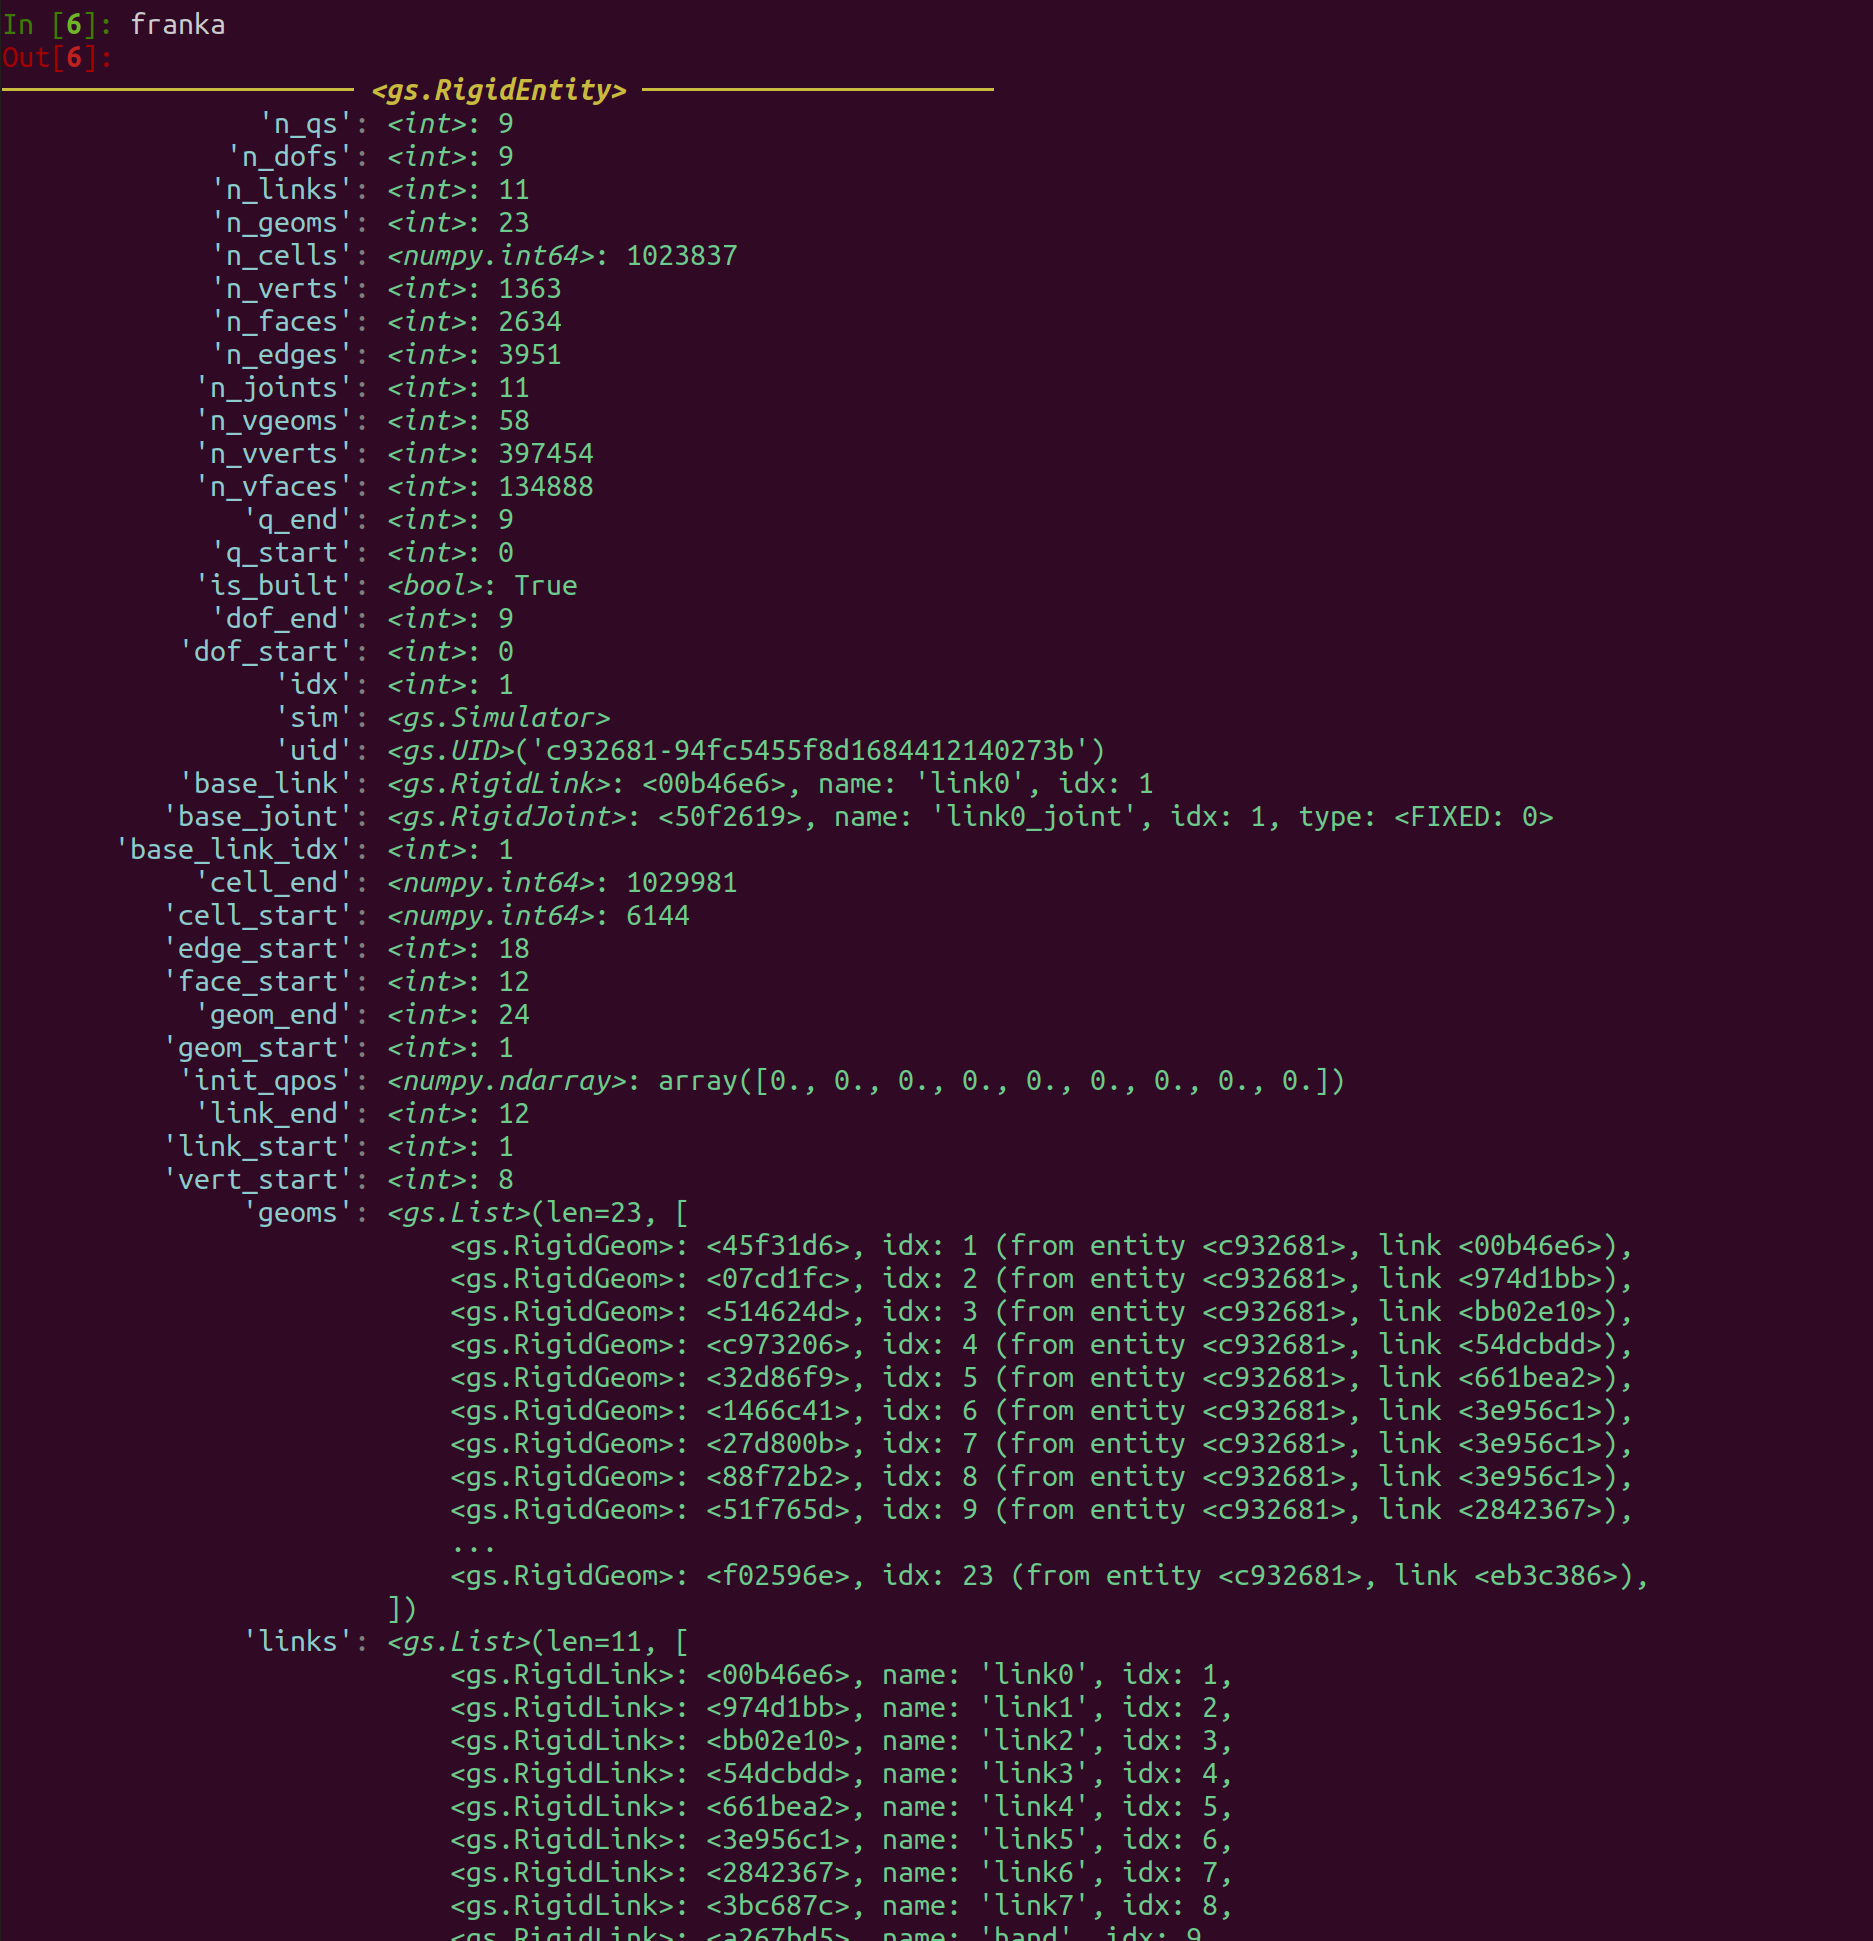
The same applies to entities. Inspect the Franka arm to see its geoms and links:
Go one level deeper with franka.links[0]:
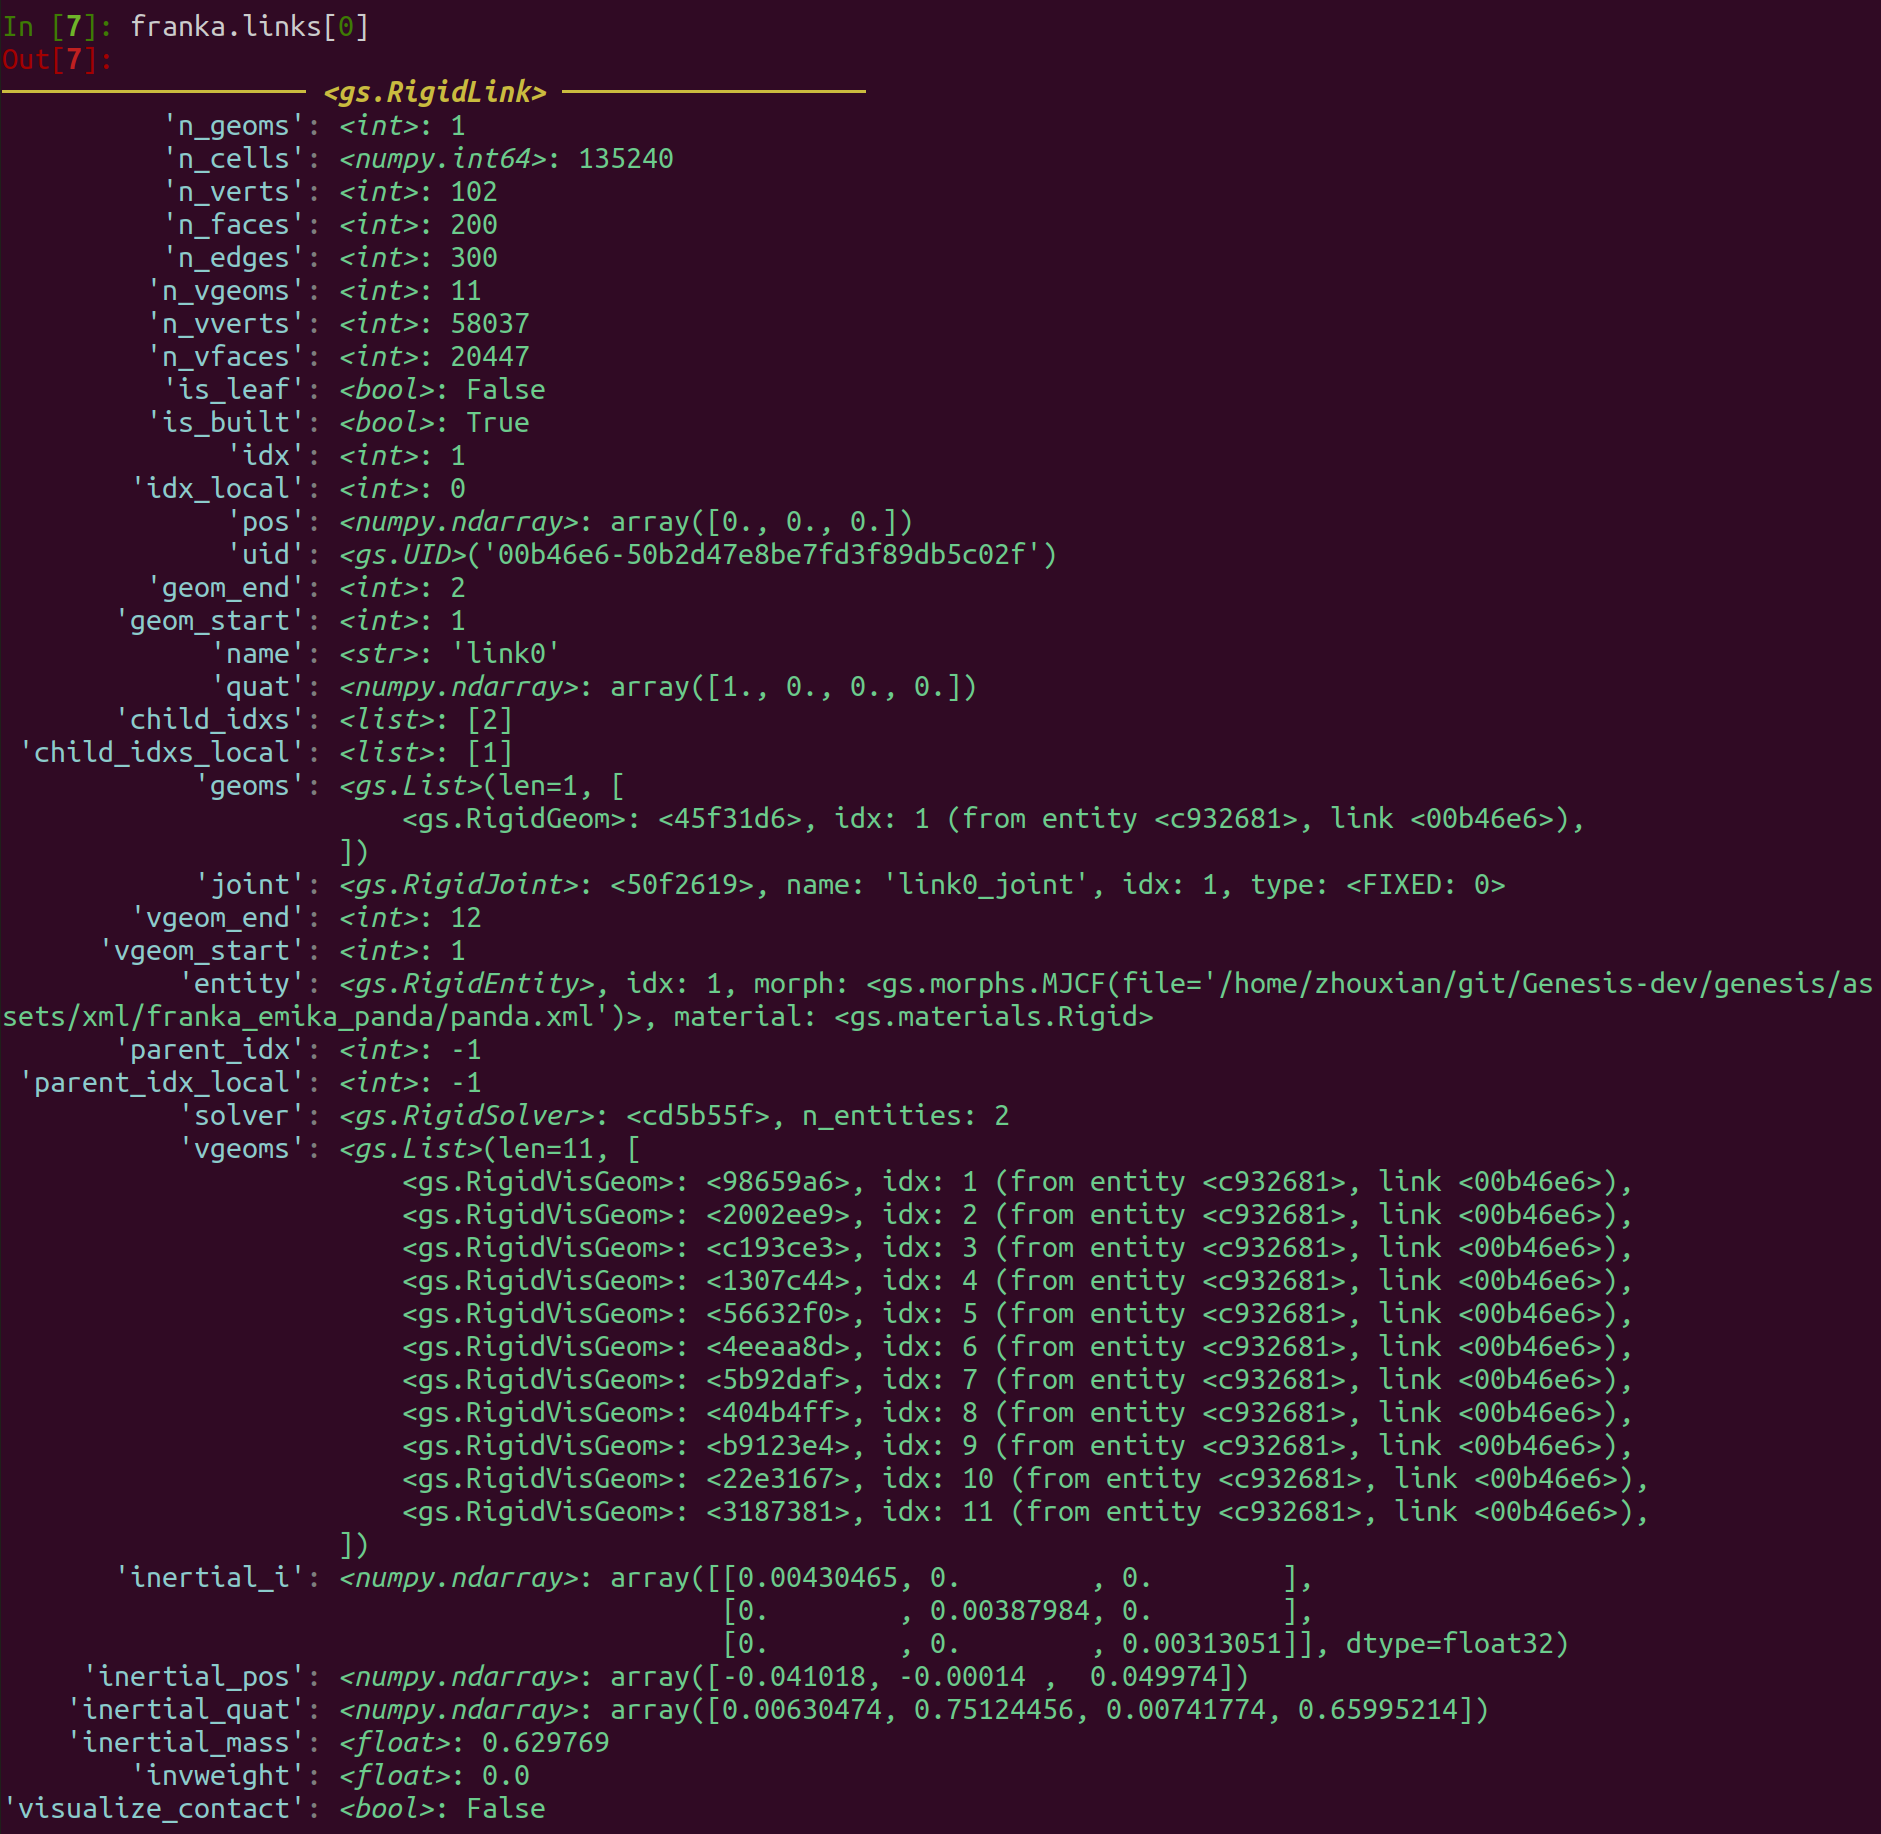
A link exposes its collision geoms (geoms), visual geoms (vgeoms), inertial_mass, its global index in the scene (idx), the entity it belongs to, and its joint.
Drawing debug geometry#
When a number in the shell isn’t enough, draw the geometry into the viewer. scene.draw_debug_* methods render primitives directly into the scene so you can see where a target pose, bounding box, or coordinate frame actually lands. They are for visualization only and take no part in the physics.
Call them after scene.build(), on a scene with a viewer or camera to render into. Each call returns a handle you keep and pass back later to remove that object.
# Axis-aligned wireframe box, bounds in meters (Z-up)
debug_box = scene.draw_debug_box(
    bounds=[[-0.25, -0.25, 0], [0.25, 0.25, 0.5]],  # [[min], [max]]
    color=(1, 0, 1, 1),  # RGBA, magenta
    wireframe=True,
    wireframe_radius=0.005,
)

# Line segment between two points
debug_line = scene.draw_debug_line(start=(0.5, -0.25, 0.5), end=(0.5, 0.25, 0.5), radius=0.01, color=(1, 0, 0, 1))

# Arrow from pos along vec
debug_arrow = scene.draw_debug_arrow(pos=(1, 0, 0), vec=(0, 0, 1), radius=0.02, color=(1, 0, 0, 0.5))

# Single sphere and a batch of spheres
debug_sphere = scene.draw_debug_sphere(pos=(1.5, 0, 0.5), radius=0.1, color=(0, 0, 1, 0.5))
sphere_positions = np.array([[2, 0, 0.3], [2, 0, 0.5], [2, 0, 0.7]])
debug_spheres = scene.draw_debug_spheres(poss=sphere_positions, radius=0.05, color=(1, 1, 0, 0.5))
Colors are RGBA in the range [0, 1]; the fourth channel is alpha. To draw a coordinate frame, pass a 4x4 transform. With color=None the three axes use the standard red/green/blue coloring:
T = np.eye(4)
T[:3, 3] = [2.5, 0, 0.5]  # translation, meters (Z-up)
debug_frame = scene.draw_debug_frame(T=T, axis_length=0.5, origin_size=0.03, axis_radius=0.02)
Debug geometry persists across steps until you remove it. Clear one object with its handle, or clear everything at once:
scene.clear_debug_object(debug_box)  # remove a single object by handle
scene.clear_debug_objects()          # remove all remaining debug objects
The available primitives:
Method |
Draws |
Key arguments |
|---|---|---|
|
A line segment |
|
|
An arrow from a point along a vector |
|
|
One or many spheres |
|
|
An axis-aligned box |
|
|
One or many coordinate frames |
|
See Scene for the full signatures and defaults.
The interactive GUI panel#
The ImGui overlay adds a Dear ImGui panel on top of the viewer, so you can drive the simulation without editing code. It exposes:
Simulation controls: play, pause, single-step, and reset.
An entity browser with per-dof joint sliders, quaternion groups for free joints, and visualization-mode toggles (visual, collision, wireframe).
Camera position and lookat sliders, plus shadow, frame, and frustum visibility toggles.
A scene-rebuild button that re-runs
scene.build()with the current entities, useful for iterating on URDFs and MJCFs without restarting the script.
Note
The overlay ships behind Genesis World’s render extras. Install them before enabling the GUI:
pip install "genesis-world[render]"
If pre-built imgui-bundle wheels are unavailable for your Python and OS combination (for example Python 3.10 on Linux aarch64), install with pip install imgui-bundle, which builds from source and requires CMake. Enabling the GUI without the dependency raises an error pointing back at this step.
The simplest way to get the panel is to set enable_gui=True on ViewerOptions. The viewer attaches the overlay for you and lets it manage scene editing internally, so a plain gs.Scene is the whole setup:
scene = gs.Scene(
    viewer_options=gs.options.ViewerOptions(
        camera_pos=(2.0, 2.0, 1.5),
        camera_lookat=(0.0, 0.0, 0.5),
        enable_gui=True,
    ),
    show_viewer=True,
)
With enable_gui=True, the viewer’s help-text overlay and default keyboard controls are turned off automatically, because ImGui captures input that would otherwise conflict with the default keybindings.
To add your own controls, grab the auto-attached plugin and register a panel. The callback receives the live ImGui module, so you can call any of its widgets:
from genesis.ext.pyrender.overlay import ImGuiOverlayPlugin

plugin = next(p for p in scene.viewer.plugins if isinstance(p, ImGuiOverlayPlugin))


def custom_panel(imgui):
    imgui.text("Custom Demo Panel")
    imgui.text("This panel was registered via register_panel()")


plugin.register_panel(custom_panel)
The full example is imgui_joint_control.py. It loads a Franka arm and a box and demonstrates the entity browser, simulation controls, scene rebuild, and a custom panel.
See also#
Viewer interaction and plugins for keybindings and writing your own viewer plugins.
Rendering for cameras, rendering, and recording.
Hello, Genesis World for the core simulation loop.