

🧑💻 Interactive GUI & Debugging#
Note
Install the optional imgui-bundle dependency before using the GUI sections below. The ImGui overlay panel ships behind Genesis’s render extras — install with:
pip install "genesis-world[render]"
If you forget and set enable_gui=True (or call ImGuiOverlayPlugin() manually), Genesis raises an actionable error pointing you back at this command. Pre-built imgui-bundle wheels are not published for every Python / OS combination (e.g. Python 3.10, Linux aarch64); on those platforms install manually via pip install imgui-bundle, which builds from source and requires CMake.
ImGui Overlay Plugin#
The ImGuiOverlayPlugin adds a Dear ImGui overlay on top of the native pyrender viewer. It exposes interactive panels for:
Simulation controls (play / pause / step / reset).
An entity browser with per-DOF joint sliders, quaternion groups for free joints, and visualization-mode toggles (visual / collision / wireframe).
Camera position and lookat sliders, shadow / frame / frustum visibility toggles, and rasterizer render-flag overrides (normals overlay, wireframe overlay).
A scene-rebuild button that re-runs
scene.build()with the current entity inventory - useful for iterating on URDFs / MJCFs without restarting the script.
from genesis.ext.pyrender.overlay import ImGuiOverlayPlugin

plugin = ImGuiOverlayPlugin()
scene.viewer.add_plugin(plugin)
You can register your own panels alongside the built-in ones with plugin.register_panel(callback). The callback receives the live ImGui module and can call any of its widgets:
def custom_panel(imgui):
    imgui.text("Custom Demo Panel")
    if imgui.button("Trigger something"):
        ...

plugin.register_panel(custom_panel)
The full example script is at examples/gui/imgui_joint_control.py. It loads a Franka arm and a box, and demonstrates the entity browser, simulation controls, and a custom panel registered via register_panel.
Enabling the GUI panel in any example#
If you just want the panel on top of an existing example without writing any plugin boilerplate, set enable_gui=True on ViewerOptions. The viewer auto-attaches an ImGuiOverlayPlugin for you:
scene = gs.Scene(
    viewer_options=gs.options.ViewerOptions(
        camera_pos=(0, -3.5, 2.5),
        camera_lookat=(0.0, 0.0, 0.5),
        camera_fov=40,
        max_FPS=60,
        enable_gui=True,
    ),
    show_viewer=True,
)
A couple of things to know:
When
enable_gui=True, the in-viewer help-text overlay ([i]: show keyboard instructions) and the default keyboard controls (camera arrow-key movement, etc.) are turned off automatically — the GUI panel replaces both, and ImGui’s input capture would otherwise conflict with the default keybind plugin.On a vanilla
gs.Scene, the panel’s scene-editing controls (Rebuild Scene, Add Entity, per-entity Remove) render in their disabled visual state with an explanatory tooltip — those features rely ongs.InteractiveScene’srebuild()semantics. Construct your scene viags.InteractiveScene(...)instead to enable them fully.
For a complete Franka PD-control example you can try this on, see examples/rigid/control_franka.py — add enable_gui=True to its ViewerOptions and run it to see the panel.
Interactive Inspection#
We designed a very informative (and good-looking, hopefully) interface for accessing internal information and all the available attributes of objects created in Genesis, implemented via the __repr__() method for all the Genesis classes. This feature will be very useful if you are used to debugging via either IPython or pdb or ipdb.
Let’s use IPython in this example. Install it via pip install ipython if you don’t have it. Let’s go through a simple example here:
import genesis as gs

gs.init()

scene = gs.Scene(show_viewer=False)

plane = scene.add_entity(gs.morphs.Plane())
franka = scene.add_entity(
    gs.morphs.MJCF(file='xml/franka_emika_panda/panda.xml'),
)

cam_0 = scene.add_camera()
scene.build()

# enter IPython's interactive mode
import IPython; IPython.embed()
You can either run this script directly (if you have IPython installed), or you can just enter an IPython interactive window in terminal and past the code here without the last line.
In this small block of code, we added a plane entity and a Franka arm. Now, if you are a newbie, you would probably be wondering what a scene actually contains. If you simply type scene in IPython (or ipdb or pdb or even a native python shell), you will see everything inside the scene, formatted and colorized nicely:
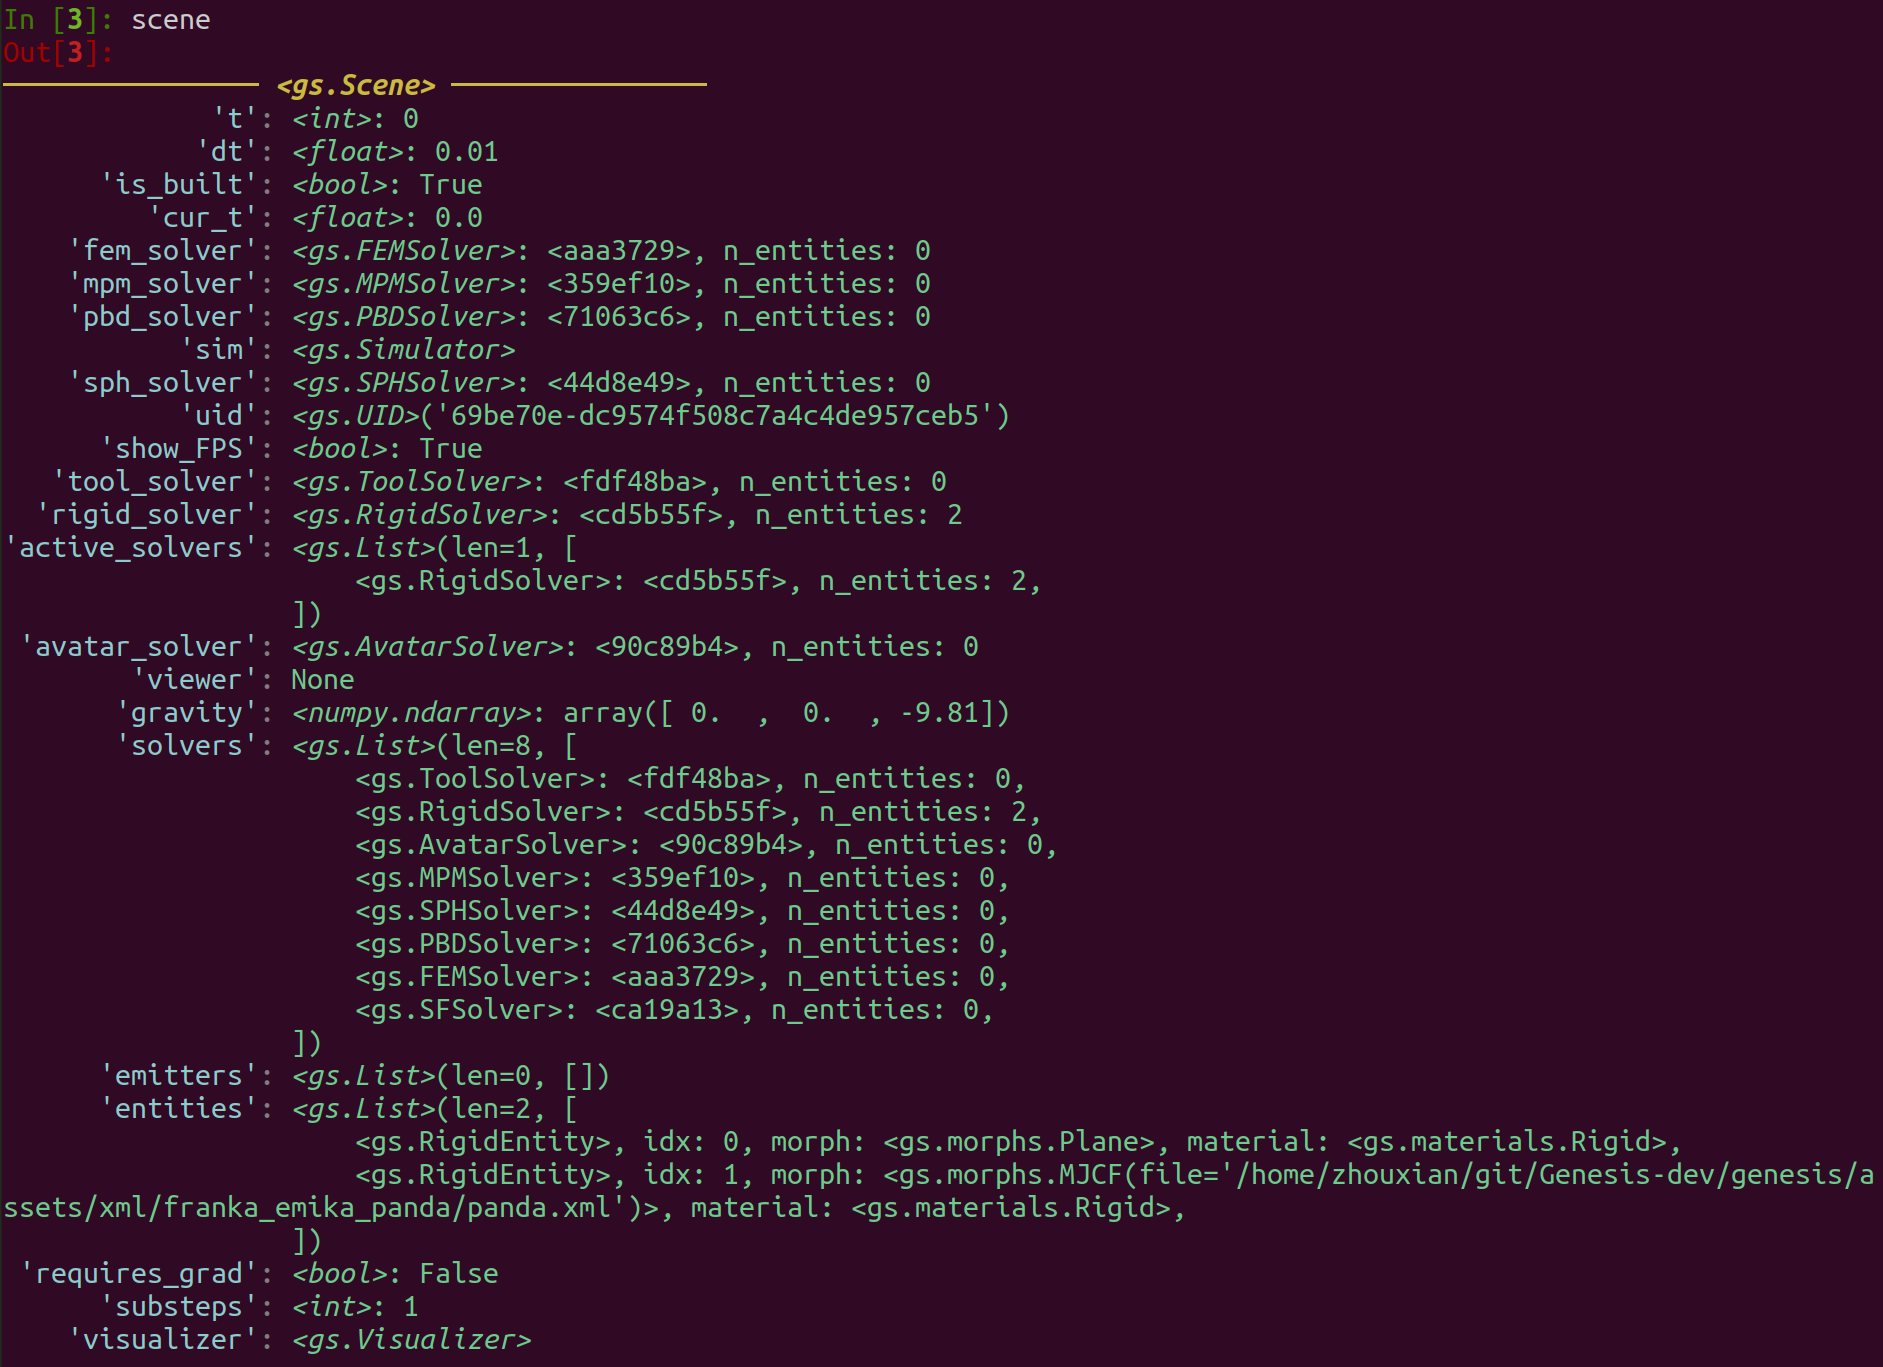
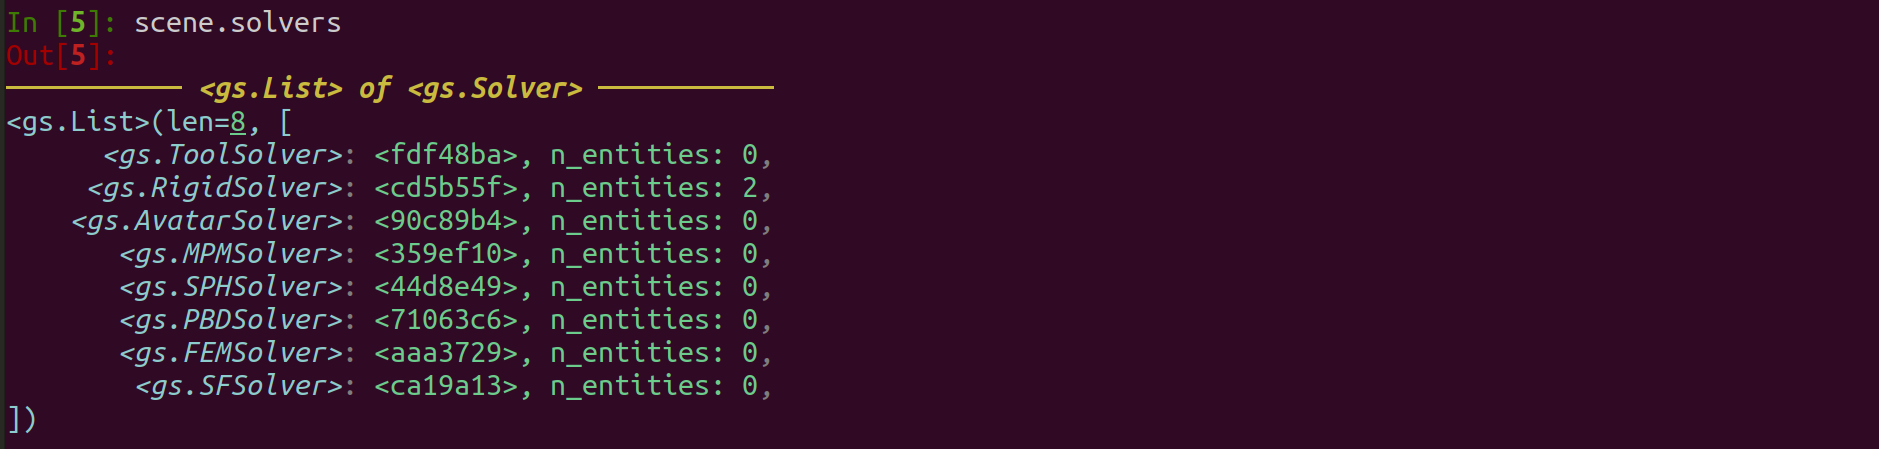
In the top line, you will see the type of the object (<gs.Scene> in this case). Then you will see all the available attributes inside it. For example, it tells you that the scene is built (is_built is True), its timestep (dt) is a float of value 0.01 seconds, and it unique id (uid) is '69be70e-dc9574f508c7a4c4de957ceb5'. The scene also has an attribute called solvers, which is essentially a list of different physics solvers it has. You can further type scene.solvers inside the shell and inspect this list, which is implemented using a gs.List class for better visualization:
You can also inspect the Franka entity:
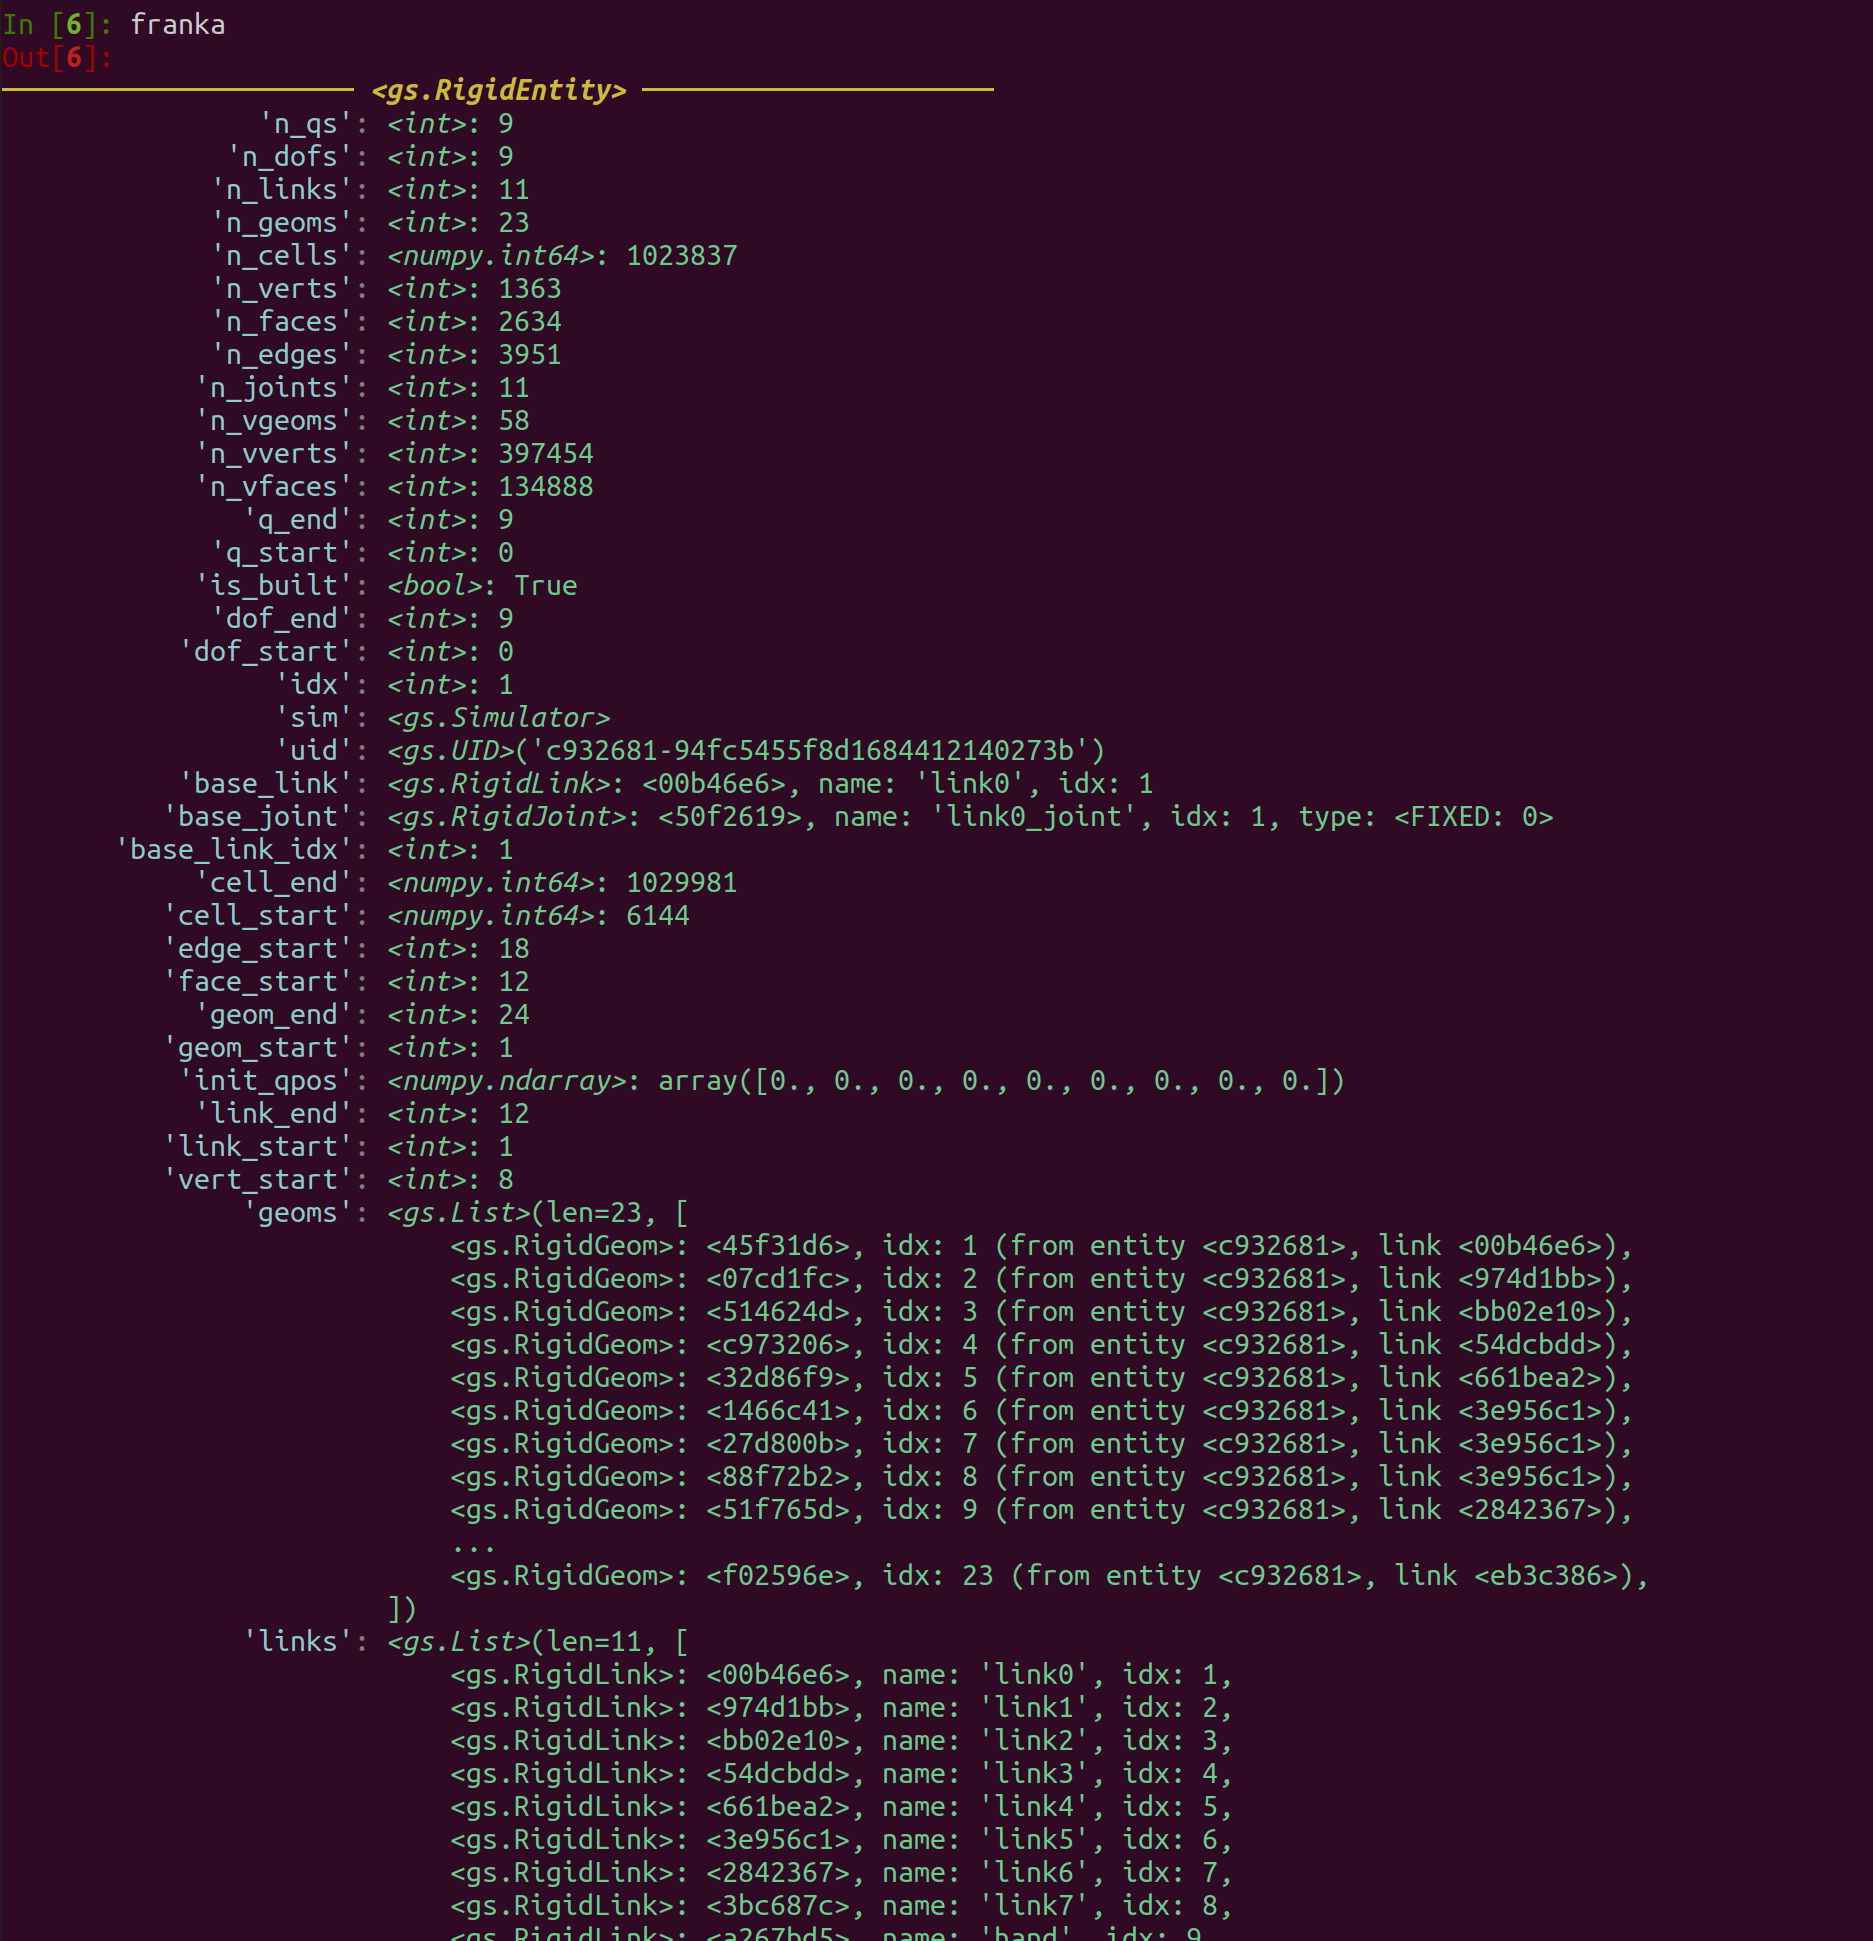
Here you would see all the geoms and links it has and associated information. We can go one layer deeper, and type franka.links[0]:
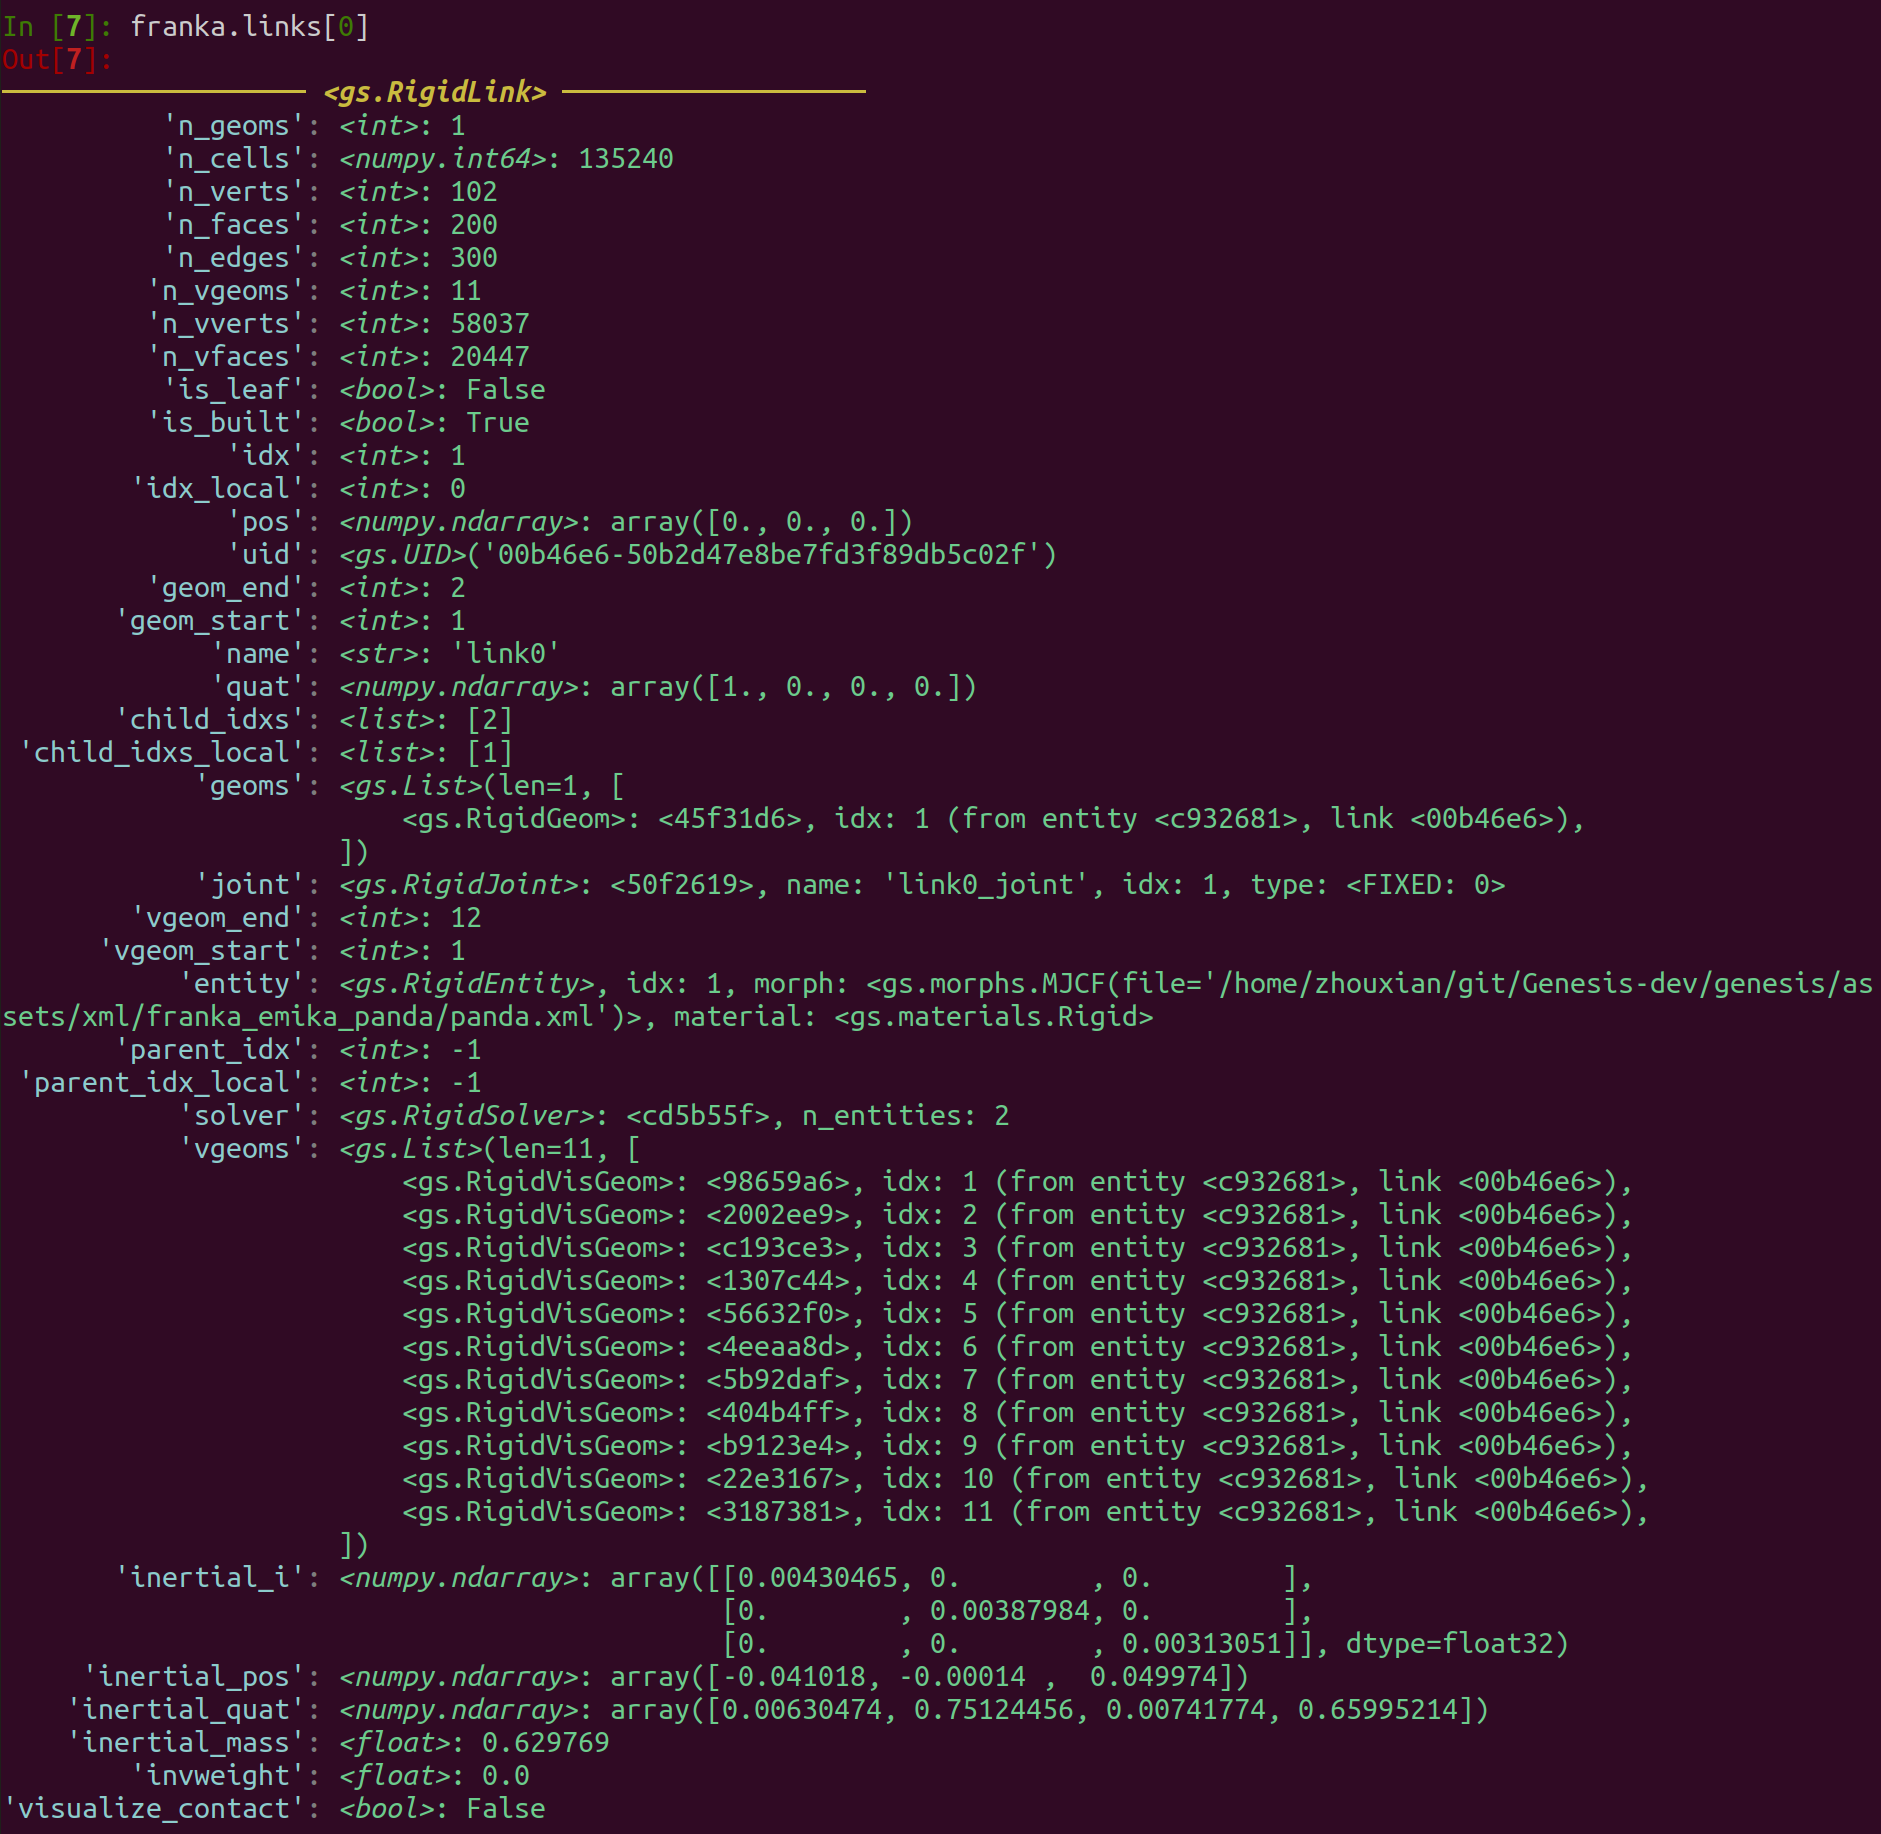
Here you will see all the collision geoms (geoms) and visual geoms (vgeoms) included in the link, and other important information such as its inertial_mass, the link’s global index in the scene (idx), which entity it belongs to (entity, which is the franka arm entity), its joint (joint), etc.
We hope this informative interface can make your debugging process easier!